Gartner Peer Insights Voice of the Customer Methodology
For May 2021 to October 2022 publish. Click here for April 2021 publish and earlier. Click here for November 2022 publish and later.
Last Updated: April 2022
Gartner Peer Insights is a free peer review and ratings platform designed for enterprise software and services decision makers. Reviews are organized by products in markets that are defined by Gartner Research in Magic Quadrant and Market Guide documents.
The “Voice of the Customer” is a document that applies a methodology (documented here) to aggregated Gartner Peer Insights’ reviews in a market to provide an overall perspective for IT decision makers. This aggregated peer perspective, along with the individual detailed reviews, is complementary to expert-generated research such as Magic Quadrants and Market Guides. It can play a key role in your buying process, as it focuses on direct peer experiences of buying, implementing and operating a solution.
Understanding the “Voice of the Customer” Methodology
Vendors in the “Voice of the Customer” document are categorized into four quadrants based on User Interest and Adoption (X-axis) and Overall Rating (Y-axis). Vendors from any of the four quadrants may be the best fit depending on your business needs.
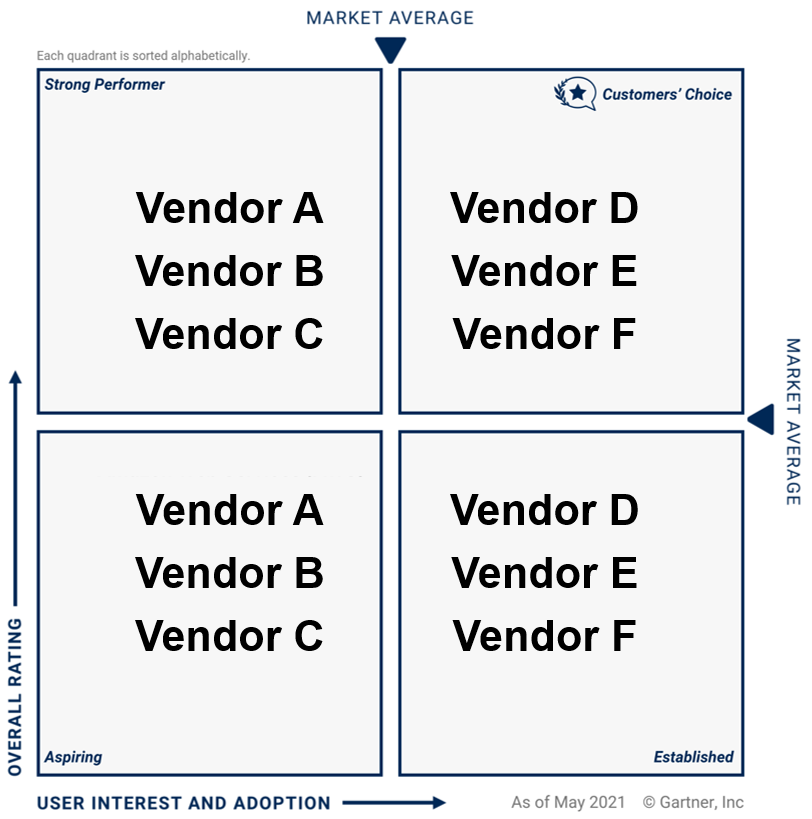
Note: Names for upper left, lower left, and lower right quadrants applicable for documents published starting October 2021.
User Interest and Adoption (X-axis)
User Interest and Adoption scores incorporate three factors, each given equal weight: review volume, user willingness to recommend, and review market coverage across industry, company size, and deployment region.
- Review volume is calculated using the total number of eligible reviews (see below for eligibility details) for a vendor over the time period. An asymptotic function is applied to reduce sensitivity to small changes in review count, especially for vendors with a large number of reviews.
- Willingness to recommend is calculated based on the responses to the question “How likely is it that you would recommend this product or service to a friend or colleague?” The reviewer can select a response on a rating scale of 0 to 10, where 0 is “not at all likely” and 10 is “extremely likely.” The response is considered “willing to recommend” if the rating is greater than or equal to 8 and “not willing to recommend” if the rating is less than 8. For reviews first submitted in mid-2018 or that came from the Magic Quadrant Reference Survey, the question “Would you recommend this product to others” was asked instead, with responses including “yes,” “yes, with reservations,” “I don’t know,” and “no.” The response is considered “willing to recommend” only if the reviewer chose “yes.” A vendor’s willingness to recommend score is the percentage of “willing to recommend” responses for both questions as defined above out of the total number of responses to the question.
- Review market coverage is calculated by counting the number of different industry types, company sizes, and deployment regions for which the vendor has at least 5 eligible reviews. An asymptotic function is applied to this count so that low market coverage results in a lower score but returns diminish for very high coverage. If an eligible review does not have industry, company size, or deployment region information, it will not contribute to the calculation for that bucket but will be included for all other calculations.
- Industry of the reviewer is based on the reviewer profile industry. Reviewers can select from one of the standard industry categories:
- Communications
- Construction
- Education
- Energy and Utilities
- Finance
- Government
- Healthcare
- Manufacturing
- Media
- Retail
- Services
- Transportation
- Deployment region is a question in the survey that each reviewer must answer. They can select one or multiple regions:
- Asia/Pacific
- Europe, Middle East and Africa
- Latin America
- North America
- Company sizes are grouped based on reviewer profile details as entered by reviewers in one of the following categories:
- 10B+ USD
- 1B – 10B USD
- 50M – 1B USD
- Public Sector, Gov’t, Edu
- Industry of the reviewer is based on the reviewer profile industry. Reviewers can select from one of the standard industry categories:
A vendor must meet or exceed the mean of all eligible vendors’ User Interest and Adoption scores to qualify for the right-hand quadrants.
Overall Rating (Y-axis)
A vendors’ score, or Overall Rating, is the calculated average of responses to the following survey question on a scale of 1 (“poor”) to 5 (“excellent”): “Please rate your overall experience with this vendor.” This calculation is subject to the conditions specified in the “Review Eligibility and Weighting” section below: Only the reviews submitted within a specified 18-month period are considered, and reviews from the earliest 6 months will be given half weight.
The market average Overall Rating is calculated by taking the average of all eligible vendors’ individual Overall Rating scores. After all scores are calculated as specified here, the values are truncated to the tenths place (e.g., ‘4.512’ becomes ‘4.5’). Vendors whose truncated scores meet or exceed the truncated market average are positioned in the upper-half quadrants, while vendors below the truncated market average are positioned in the bottom-half quadrants. These truncated scores are used to position vendors in the Voice of the Customer quadrants and are listed in Figure 2 in the Voice of the Customer document.
Note that vendor ratings in the document may not exactly match the star ratings displayed on the Gartner Peer Insights site, where the default star rating is based on all published reviews, with reviews older than 12 months weighted progressively less (decreased by half every 12 months).
Understanding the Quadrants
Upper-Right Quadrant: Customers’ Choice
Gartner Peer Insights recognizes vendors who meet or exceed both the market average Overall Rating and the market average User Interest and Adoption score through Customers’ Choice distinction.
Vendors in this quadrant received strong ratings for overall experience relative to the market. This is a good indicator for satisfaction with the vendor’s products in this market.
Vendors in this quadrant also exceed the market average User Interest and Adoption, which includes review volume, review market coverage, and willingness to recommend. These factors help distinguish vendors that generated the above average overall ratings required for this quadrant within large sample sizes and diverse coverage. High willingness to recommend is an overall measure of users’ interest and enthusiasm based on their experience with the vendor. Vendors in this quadrant may not have performed equally highly in all three of these components.
Product selection processes that value mainstream adoption and broad coverage would find vendors in this quadrant a likely fit. Processes that prioritize specialized, verticalized, customized or novel solutions should also consider other quadrants when formulating a short list.
Upper-Left Quadrant: Strong Performer
Vendors who are rated equal to or above the market average Overall Rating but do not meet the market average User Interest and Adoption score.
Vendors in this quadrant received strong ratings for overall experience relative to the market. This is a good indicator for satisfaction with the vendor’s products in this market.
However, vendors in this quadrant are below the market average User Interest and Adoption. There are several possible reasons for this: the vendor may have received a lower volume of reviews during the 18-month period captured in this document; the vendor’s business model may be focused on a narrower set of regions, industries, or company sizes; or users may be unwilling to recommend the vendor.
Vendors in this quadrant can be worth investigating further as they score well on overall experience, may have a strong willingness to recommend, and may excel at specific use cases, in specific industries or regions, or for specific organization sizes.
Lower-Right Quadrant: Established
Vendors whose ratings are less than the market average Overall Rating but have higher-than-average User Interest and Adoption.
Vendors in this quadrant received below-average ratings for overall experience relative to the market.
However, vendors in this quadrant also exceed the market average User Interest and Adoption, which includes review volume, review market coverage, and willingness to recommend. High review volume is an indicator of high user adoption and confidence in the vendor’s placement due to a larger sample size. High review market coverage indicates the vendor’s coverage across a diverse range of industries, regions, and company sizes. High willingness to recommend is an overall measure of users’ interest and enthusiasm based on their experience with the vendor. Vendors in this quadrant may not have performed equally highly in all three of these components.
It is important not to overlook these vendors because they have generated high user interest and users are willing to recommend them. Additional investigation may need to be done to determine if the reasons for the user interest represented in this report align with your organization’s needs.
Lower-Left Quadrant: Aspiring
Vendors who have ratings less than the market average Overall Rating and have lower-than-average User Interest and Adoption.
Vendors in this quadrant are below the market average on both Overall Rating and User Interest and Adoption. However, vendors in this quadrant can be worthy of consideration for users, depending on specific use cases. Like all vendors in this report, their products align to this market and they have met the minimum criteria to be included. If a vendor is newer to the enterprise space, unique in some ways, or innovating rapidly, they could appear in this quadrant. However, it is also possible that vendors who are struggling to reach long-term viability also appear here. Due to these possible mixed results, users must delve into the review details and cross-check with other Gartner research resources to make better decisions.
Review Eligibility and Weighting
Eligible reviews used for the “Voice of the Customer” are only those reviews published on the Gartner Peer Insights site that were submitted:
- In the 18-month period specified in the “Voice of the Customer” document.
- From end users of companies with >$50M in annual revenue.
- For products that are actively being sold by vendors. Reviews for legacy products (no longer being sold by the vendor) will be excluded from all calculations.
- And included in the ratings calculations on the Peer Insights site (excluding vendor partner reviews, etc.)
Additionally, reviews from the first 6 months of the 18-month period will be given 50% weight in all calculations for both axes. This means that one review from the first 6 months will have half the impact of one review from the next 12 months in determining a vendor’s X-axis (including all 3 components: review volume, willingness to recommend, and review market coverage) and Y-axis scores. The 18-month review period allows for a larger sample size of reviews and greater confidence in each vendor’s placement on the quadrant. The 50% weighting for reviews in the first 6 months allows more recent reviews to factor more heavily in determining a vendor’s placement.
Vendor Inclusion Criteria
To be included in the “Voice of the Customer” report for a Gartner Peer Insights market, a vendor must have a product that aligns to that market as determined by Gartner Peer Insights and have 20 or more eligible reviews during the specified 18-month submission period. A dedicated Gartner Peer Insights market alignment team uses a set of criteria for evaluating whether a technology provider’s products and/or services align with the Gartner Peer Insights market definitions. Learn more about the process here.
As the “Voice of the Customer” document was created to help end users shortlist vendors in their buying/selection process, it was important to provide a focused report. Therefore, there is a limit to the maximum number of vendors included in this document. Peer Insights has set the limit such that it is high enough for end users to find options they might not know about but are still effective to be put to use in the end user’s process.
Currently, Gartner Peer Insights limits the number of vendors included in the document to 25. If more than 25 vendors meet the inclusion criteria, the 25 vendors with the highest number of eligible reviews will be included. If two or more qualified vendors with the same number of eligible reviews tie for the 25th position, all vendors in the tie will be included in the document.
“Voice of the Customer” Segment View
Understanding the “Voice of the Customer” Segment View Quadrants
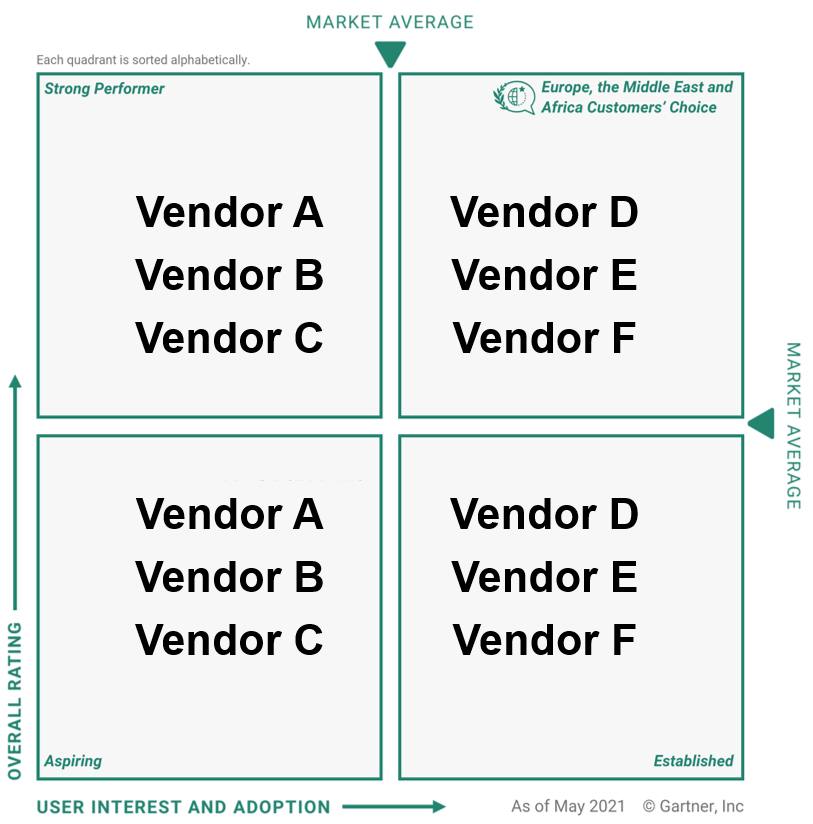
In response to end-users’ desire to evaluate solutions based on specific attributes of their organization, such as industry, company size, or deployment region, Gartner Peer Insights now provides analyses for those categories where there was sufficient review volume. The full list of industries, company sizes, and deployment regions can be found above in the “User Interest and Adoption” section. In each segment graphic, vendors are positioned in different quadrants based on their reviews within the specified segment. As with the overall market “Voice of the Customer,” the X-axis represents User Interest and Adoption and the Y-axis represents Overall Rating. Gartner Peer Insights recognizes highly-rated vendors in categories through the Customers’ Choice Segment Distinction.
The review inclusion criteria, vendor inclusion criteria, y-axis, and four quadrants for the Segment View follow the same logic as the overall “Voice of the Customer” (see above), except that only reviews within the segment are included in the calculations. For example, for a vendor to be included in the Finance Segment View, the vendor must have at least 20 reviews that meet all Review Eligibility criteria listed in the relevant section above and are from reviewers in the Finance industry.
The calculation of the X-axis (User Interest and Adoption) for the Segment View differs slightly from the approach for the overall market “Voice of the Customer.” For Segment View, X-axis scores incorporate two factors, given equal weight: review volume and user willingness to recommend. These are calculated in the same way as specified in the relevant section above, except that only reviews within the segment are included in the calculations. Because the Segment View focuses on a single segment, it does not incorporate review market coverage across industry, company size, and deployment region.
Update History
- Names for upper left, lower left, and lower right quadrants applicable for documents published starting October 2021.
- As of November 2021, we have clarified rules around vendors’ Overall Ratings and market average ratings (see “Overall Rating” section).
- As of April 2022, we have clarified that reviews from vendors partners will continue to be excluded from the VOC.
Frequently Asked Questions
Gartner Peer Insights “Voice of the Customer” FAQ
Gartner Peer Insights User FAQ
Resources for Users
Gartner Peer Insights
“Interactive Magic Quadrant With Peer Insights User Reviews”
Resources for Technology and Service Providers
Technology Provider Portal
Technology Provider FAQ
Contact
peerinsights@gartner.com
General Gartner contacts
Become a Gartner client